

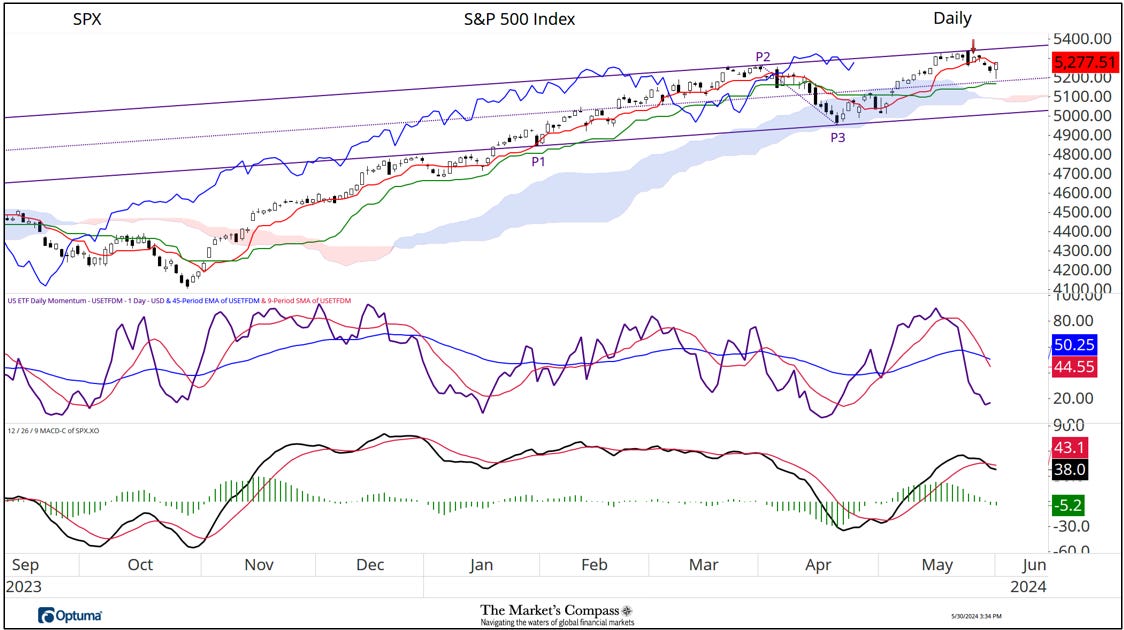
In Tuesday’s US Index and Sector ETF Study that I sent to my paid Substack subscribers, I reviewed the short-term technical condition of the S&P 500 Index titled, “Thoughts on the short term technical condition of the SPX Index” which is only one part of the complete Study. At that time (that I have highlighted today with a red arrow), I wrote… “In early May when the SPX Index regained the ground above the Daily Cloud Chart, I applied a Schiff Modified Pitchfork (violet P1 through P3). Since a week ago last Wednesday prices have been capped by the Upper Parallel (solid violet line) of that pitchfork. Last Thursday the index produced a nasty outside day or in candle parlance an engulfing candle but thus far it has not unfolded into a full-fledged reversal. What has developed thus far has been a sharp turn in my US ETF Daily Momentum / Breadth indicator which has fallen sharply despite prices holding near to the recent highs. MACD has also not confirmed the recent price highs and is beginning to roll over. I believe that odds favor a degree of backing and filling that will drive prices to key short-term support at the Median Line (violet dotted line) of the pitchfork, the Kijun Plot (green line) and the Cloud”. The technical thesis that I suggested at that time has unfolded as expected. The SPX traded lower until it tested support at the Median Line yesterday and an intraday reversal drove the large cap Index to the highs of the day. It remains to be seen whether that is the extent of the price pullback, but my US ETF Momentum / Breadth Oscillator is approaching “oversold territory” and despite what have been an “end of month markup” there is still an underlying bid in the SPX.
Become a paid subscriber to have the Market’s Compas ETF Studies, the Sweet Sixteen Crypto Studies and the new Weekly Speculator sent to your e-mail directly.
For readers who are unfamiliar with the technical terms or tools referred to in the comments on the technical condition of the SPX can avail themselves of a brief tutorial titled, Tools of Technical Analysis or the Three-Part Pitchfork Papers that is posted on The Markets Compass website…
https://themarketscompass.com
Charts are courtesy of Optuma.
To receive a 30-day trial of Optuma charting software go to…