We’ve witnessed something that feels unusual over the last week.
Those large cap stocks that have been so popular for the last three years have been falling like a rock while other small pockets of the market have shot higher.
The shift in sentiment has everything to do with the fact that the Fed is likely to drop interest rates in September, and EVERYONE loves to buy stocks when rates are dropping.
We call it the “Risk On” trade.
It represents investors’ willingness to step out of their comfort zone to buy stocks that may not be the most popular, or largest by market cap. Instead, they start to look for values or more speculative traders that will bolster their returns.
The sudden surge in buying has had an unintended effect on short sellers, providing an opportunity to turn their bad luck into your gains.
It’s called a short squeeze, and here’s why it works
Shorting a stock can be a dangerous undertaking. You’re betting that the stock will decline and using margin accounts to do it which means that you’re leveraged.
If the stock goes down, the shorts are happy, and they pocket their profits.
It’s a totally different story when a stock goes up though. When this happens, the short sellers start feeling the pain as their leveraged losses start to add up quickly.
At some point, they must call it quits and cover their positions to limit losses.
When a whole bunch of bearish pros on a particular stock start to cover all at once – meaning they’re elbowing one another and stampeding through the narrowest of doorways and grabbing shares at every and any price – that stock can go parabolic. That’s a “short squeeze.”
How do you find a short squeeze before it happens?
It feels like we read or watch stories about shorts squeezes after they’ve made millions for investors that appear to be “in the know”. That’s not the case.
You can find short squeeze candidates using a simple approach.
- Find stocks with “high” short interest, usually a short interest ratio of 6 or higher will do it.
- Filter those stocks to find only the stocks with high short interest that are in a bullish trend.
- Identify a “Trigger Price” at which short sellers are likely to run into the market to cover their losing positions.
Currently, the number of companies with a short interest ratio above 6 is 320. That number is higher than just two weeks ago, indicating that short sellers have been betting even more against the market.
Remember, short sellers only get squeezed out of their positions when the stock is going higher. They make money and stay short when a stock price is in a bearish trend.
That’s not the case now as we’ve seen a sudden rush of fast and aggressive rallies higher.
Look at the Russell 2000 Index.
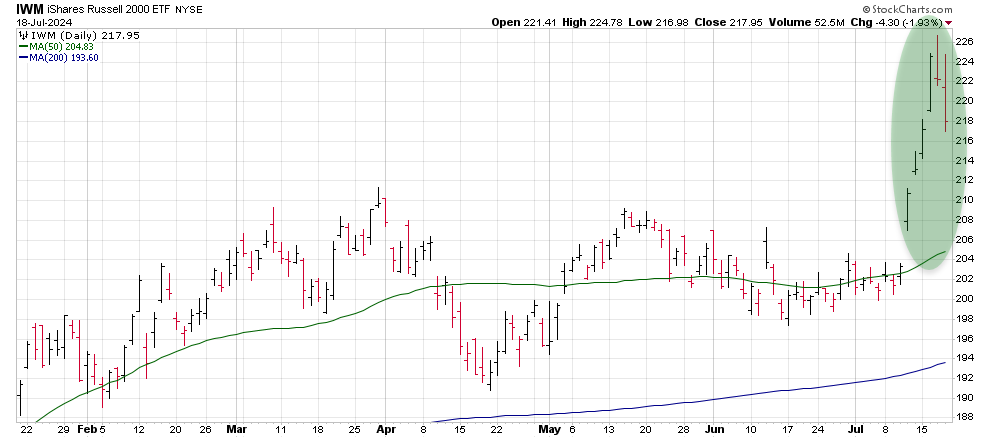
In the last week this index of small cap stocks has rallied more than 10%. The kicker is that short interest on small cap stocks is always higher than short interest on the Nasdaq 100 stocks.
For that reason, we’re seeing a ton of short squeeze opportunities in the small cap sector.
Here are a few characteristics of the current short squeeze list.
- The short squeeze candidate with the largest market capitalization is Royal Bank of Canada (RY).
- The group with the most short squeeze candidates is the Health Care industry with 26 stocks.
- The energy sector is the group that has seen the largest decline in short squeeze candidates over the last two weeks.
Let’s look at the top short squeeze candidates.
Now, a closer look at three of the candidates with Trigger and target prices.
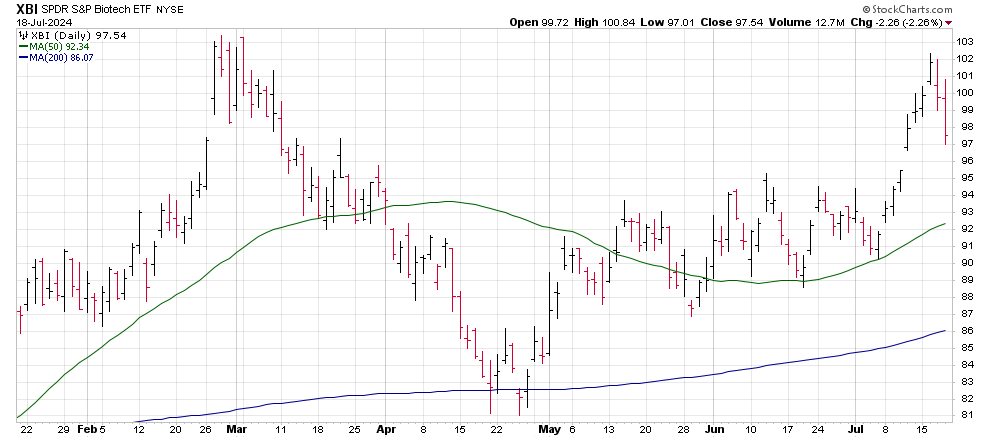
S&P Biotech ETF (XBI)
Interesting fact that makes sense, biotech stocks, by their nature, have higher short interest than average stocks.
Short sellers troll on this group of stocks given that they tend to have a high failure rate.
The nature of the biotech industry is that most of its companies are in the process of developing new drugs that may not find their way to market. For that reason, the short sellers are always active here.
That risk becomes lowered when you “pool” or diversify the companies into an ETF, which is why the Biotech ETF is currently a good candidate.
With a current short interest ratio of 6.6, the S&P Biotech ETF is the only ETF prepared for a technical squeeze as price trends and the ETFs recent break out of a trading range is likely to cause the shorts to start buying the ETF.
In mid-June, the S&P Biotech ETF 50-ay moving average turned bullish, pushing the price of the XBI shares above $95 to $100 in less than a week’s trading.
The ETF ran into round-numbered resistance at that $100 price, but the ETF is lined-up for support at $95.
A break above $100 is what will serve as the “trigger” for shorts to start covering their losing positions, fueling another 10-20% rally as we head into the November elections.
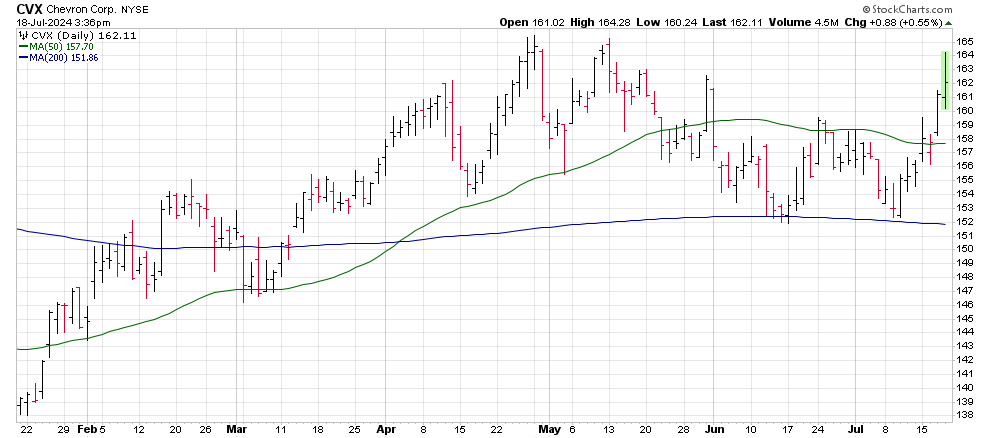
Chevron (CVX)
Chevron shares are about to make a bullish breakout that will have the shorts shaking.
Shares of the oil & gas company have been trading in a range for the last two months as investors have watched the price of oil and election campaigns.
Geopolitical tensions and other factors are beginning to drive oil prices back towards their highs serving as a positive catalyst for the large oil companies like Chevron.
In addition, election watchers are beginning to invest more heavily on a Trump White House, which may translate into more production from the likes of Exxon-Mobile, Haliburton and Chevron.
Shares of Chevron have been tracking closely with the trend in oil, leading them to a breakout to above $105. Those highs will not represent new “all-time” highs though as the stock is still trading about 8% its 2022 high prices.
This leads to potential for a long-term short covering as we will likely see shorts exit position as Chevron moves above $165 while new short sellers will add to positions on the hopes that the stock will revert below that price.
A continuation in the rally will flush the new shorts out as the stock crests above $175 with a target of $200.
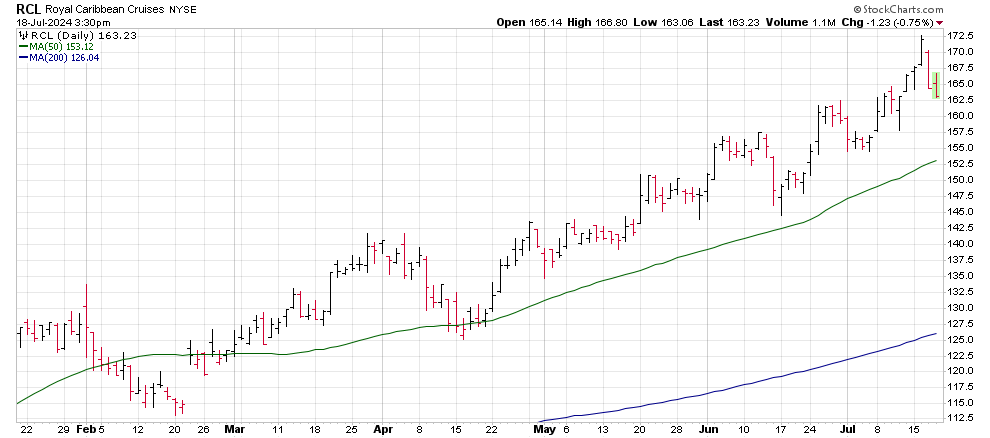
Royal Caribbean Cruise Lines (RCL)
Royal Caribbean has found itself in a travel “sweet spot”.
The cruise lines operator has been generating steady revenue growth and earnings that have beaten Wall Street analysts.
As a result, RCL shares have returned 30% over the last 6 months, more than double the Nasdaq 100. The company’s fundamental strength and price trends have been the catalyst for several Wall Street upgrades to the stock.
Despite that, the short sellers have been adding to their positions.
Short interest on Royal Caribbean Cruise Lines sits at almost seven times the stock’s daily average volume. The short-to-float ratio for the stock sits at 7%. We didn’t see short sellers close positions over the last two weeks, but that’s likely to change.
RCL shares have been on a low volatility bullish trend since the stock saw a slight pullback in April.
That low volatility move has to be pressuring the shorts to start closing their positions, but they haven’t yet.
The company is set to announce their quarterly earnings on July 25. Last quarter, Royal Caribbean Cruise Lines beat analyst earnings er share target by $0.44 (a 33% beat) while growing revenue 30%. Another quarterly call like this will send the stock into orbit as the short finally tap out on the stock.
Checking the options market, there has been significant options activity at the August $190 calls. This indicates a high degree of speculation that the stock will best earnings next week and propel the stock to $200 or higher.
Watch for a move above $170 to jettison the stock to a target price of $190 to $200.