

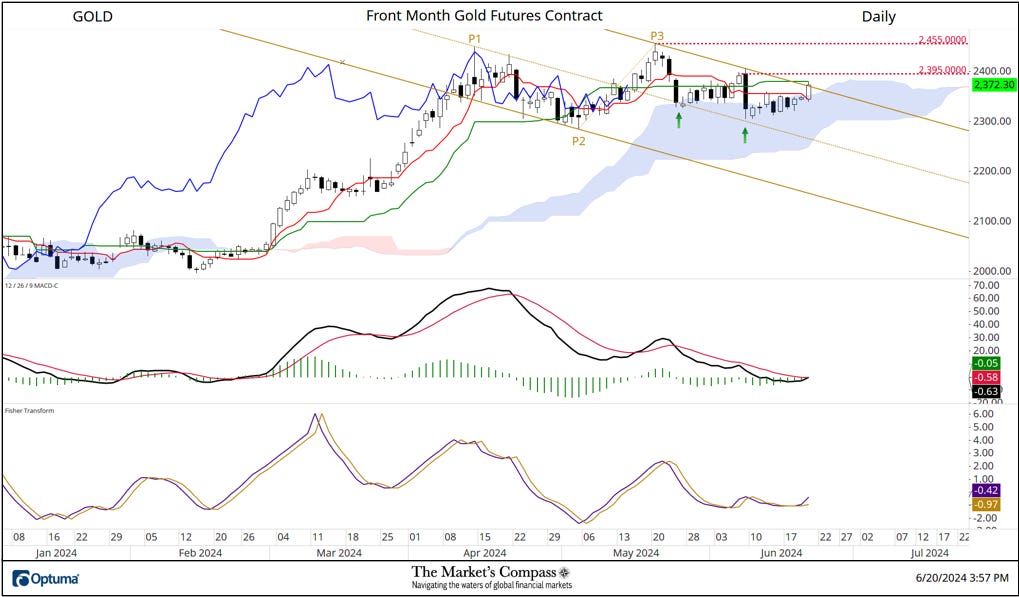
When the front month gold futures contract fell off from the May 20th higher high (gold P3) I applied a Standard Pitchfork (gold P1 through P3) to the chart. What tells me that this was the correct variation of the pitchfork that I used is that prices held support at the Median Line (gold dotted line notated with green arrows) since I drew it. Also prior to the price pivot at P2 prices respected support at the Lower Parallel (solid gold line). The correct vector or angle of the pitchfork identified both down legs of the corrective phase (gold P1 through P2 and P3 through today).
That said, for the second time in ten days the Upper Parallel (upper solid gold line) has capped inter-downtrend rallies on a closing basis and on an intra-day basis resistance at the Kijun Plot (solid green line) came into play. Downside momentum is slowing as witnessed by MACD which is now walking the dead neutral tight rope and is hinting at a hook higher. This is in concert with a turn in the Fisher Transform above its signal line. A follow through to yesterday’s rally that overtakes the Kijun Plot and price resistance at $2,395 would target the May highs that are $50 higher at $2455. Yosemite Sam thought there was gold in them thar hills and I’m in his camp.
For readers who are unfamiliar with the technical terms or tools referred to in the comments on the technical condition of Gold can avail themselves of a brief tutorial titled, Tools of Technical Analysis that is posted on The Markets Compass website…
https://themarketscompass.com
Charts are courtesy of Optuma.
To receive a 30-day trial of Optuma charting software go to…