


Erik Isakson
Celestica, Inc. (NYSE:CLS) is up more than 300% in the past 12 months and +17% since the SA Quant Team recommended the mid-cap stock as a top tech Strong Buy on 2/13/2024. CLS in Q124 delivered +20% YoY sales growth and +83% EPS growth, and continues to trade at a solid valuation compared to sector peers with P/E FWD of 13x, EV/EBITDA FWD of 8.2x, and Price/Sales of 0.57x. Based on top-notch quantitative metrics and factor grades, highlighted by explosive momentum, a solid track record of profitable growth, and high consensus profit growth targets for the rest of FY24, the SA Quant Team reiterates its Strong Buy Quant Rating on CLS.
Celestica, Inc. (CLS)
-
Market Capitalization: $5.22B
-
Quant Rating: Strong Buy
-
Quant Sector Ranking (as of 5/3/24): 10 out of 556
-
Quant Industry Ranking (as of 5/3/24): 1 out of 18
Celestica, the #1 quant-rated Electronic Manufacturing Services stock and among the top ten in the Technology sector, has crushed the market and tech peers (XLK) in price performance, up more than 300% in the past year.

CLS 1Y Price Performance (SA Premium)
CLS has an ‘A+’ in Momentum and EPS Revision Factor Grades and Bs in Valuation, Growth, and Profitability for a Strong Buy rating of 4.95. It also has bullish ratings from SA Analysts and Wall Street Analysts. Wall Street analysts’ average price target implies 17% upside.
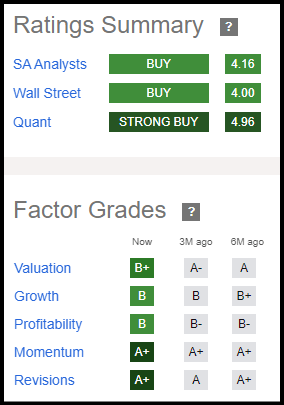
CLS Ratings Summary and Factor Grades (SA Premium)
CLS Overview & Q124 Earnings Results
Celestica, a Toronto-based company with over 21,800 employees, provides high-tech electronic manufacturing and supply chain services in North America, Europe and Asia, through two business segments: Connectivity & Cloud Solutions (CCS) and Advanced Technology Solutions (ATS). The company offers a wide-range of services and products such as compute servers, networking switches and storage hardware for hyperscaler data centers. As a supplier to the top five global hyperscalers, Celestica said it considers itself well-positioned to potentially benefit from the projected growth in hyperscaler AI/ML compute investment and data center hardware capex spending.
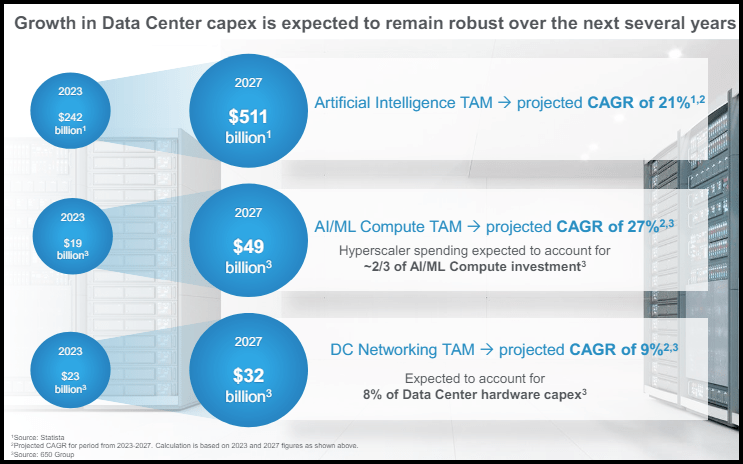
Global Data Center Capex Growth 2023-2027 (CLS Investor Presentation)
CLS exceeded earnings expectations for the 16th straight quarter in Q124 with EPS of $0.86 beating by $0.11 and revenue of $2.21 billion (+20% YoY) beating by $27.91 million.
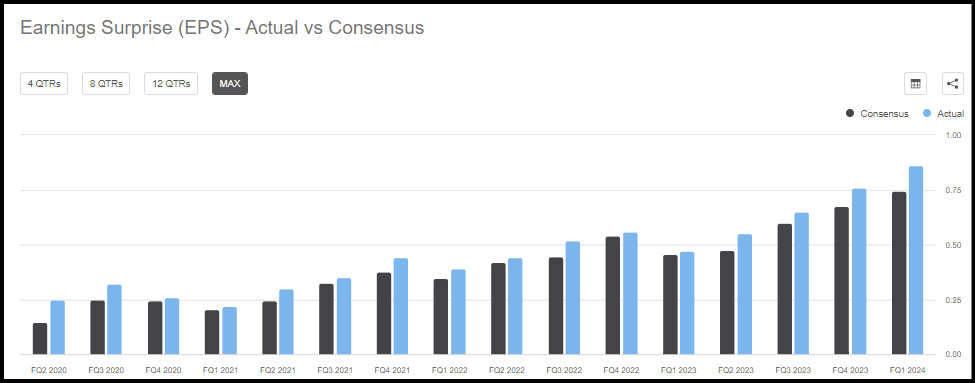
CLS EPS Surprises (SA Premium)
CCS accounted for 65% of sales in Q124 and drove most of the growth. The CCS segment’s strong performance was driven by robust demand for AI/ML compute products from hyperscaler customers, the company said on its earnings call. CLS has six earnings up revisions in the last three months, with EPS projected to grow 37% in FY 24 and 8% in FY25, according to consensus estimates. Revenue is expected to rise 14% to $9.13 billion in FY24 and 8% in FY25. Consensus estimates project EPS to grow 47% in Q224, 25% in Q324, and 11% in the final quarter of the fiscal year.
Despite consistently posting strong sales and profitable growth numbers, and exhibiting strong earnings potential, CLS is still trading at a value relative to the tech sector.
CLS Stock Valuation
CLS showcases a ‘B’ Valuation Factor Grade with a market cap of $5.22 billion vs. forward revenue of $9.13 billion for a price-to-sales per share ratio of 0.57x, a 78% discount to the sector median of 2.70x. Celestica’s trailing twelve month PEG ratio, a heavily weighted valuation metric, of 0.13, is 86% below the sector median of 0.95. CLS is trading at 13x earnings forward, a 43% discount to the sector’s 23x. CLS EV/EBITDA, EV/EBIT, and P/CF forward metrics are all 40% lower than the sector median.
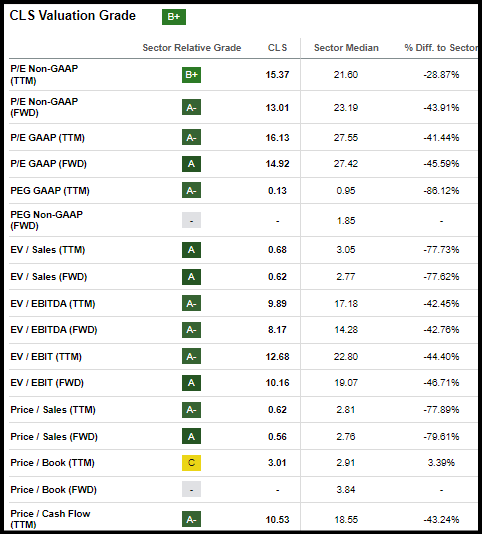
CLS Valuation Grade (SA Premium)
CLS Stock Growth & Profitability
CLS ‘B’ Growth Grade is highlighted by EPS diluted growth TTM YoY of +121%, ROE growth of +103%, while EBITDA growth is at +24% and levered FCF +34%. CLS forward growth metrics are also solid and well above the sector medians, including revenue (+10.8%), EPS (+23%), EBITDA (+16%), and EBIT (+19%). Free cash flow per share growth rate FWD is 23% and operating cash flow growth FWD is 24%, 43% and 94% above the sector, respectively.
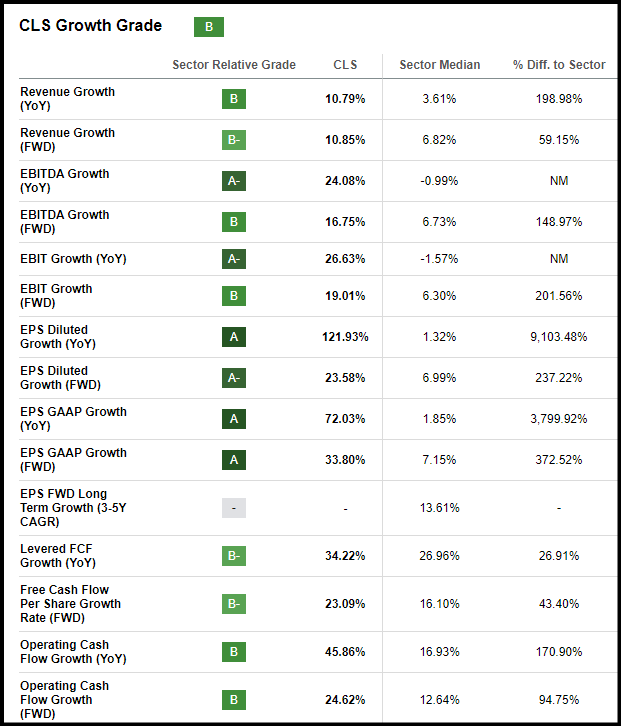
CLS Growth Grade (SA Premium)
CLS ‘B’ Profitability Grade is supported by ROE of 19% and ROTC of 11%, above the sector medians by 55% and 370%. CLS gross profit margin of 10% is well below the sector median of 48% but in line with the 12.54% industry peer median.
CLS Stock Risk Factors
Risk and size-related metrics do not fall under one of the five factor grades, but are factored into each stock’s Quant Rating. Celestica’s 60M beta of 2.35 indicates the stock is highly volatile compared to the market and the 1.14 sector median of quant-rated mid-cap peers. However, CLS 1.24 24M beta is lower than the mid-cap tech median of 1.34. Celestica’s Altman Z score, calculated based on profitability, leverage, and liquidity metrics, of 2.24 is above the financial health distress level of 1.8.
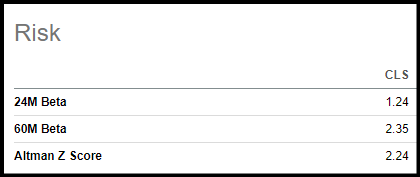
CLS Risk Metrics (SA Premium)
CLS has potentially manageable debt levels based on a D/E ratio of 48%, net debt/equity ratio of 30%, and long-term debt/total capital of 30%. CLS covered ratio is at 6.3x, indicating potentially sufficient operating profit to cover interest payments. EBITDA leverage ratio TTM is 1.0x, down 0.3 from the same period last year. In February, S&P upgraded Celestica’s credit rating to ‘BB’ citing strong operational performance and reduction of the adjusted net debt-to-EBITDA ratio. CLS has a Ba2 credit rating from Moody’s.
Concluding Summary
CLS is up more than 300% in the past year and +17% since the SA Quant Team recommended the stock as a Strong Buy in February, crushing the market and tech sector. CLS has delivered massive top and bottom line growth at an attractive price based on key quant metrics relative to the sector medians. Due to explosive momentum and growth, excellent factor grades, including ‘A+’ in valuation and EPS revisions, the SA Quant Team reiterates its Strong Buy rating for CLS. If you’re seeking a limited number of monthly ideas from the hundreds of top quant Strong Buy rated stocks, the Quant Team’s best-of-the-best, consider exploring Alpha Picks.